No Current Sellers for Stanford Research SR780
Sign Up/Login to get notified when someone has one for sale.
Manufacturer: Stanford Research
Model: SR780
Description:
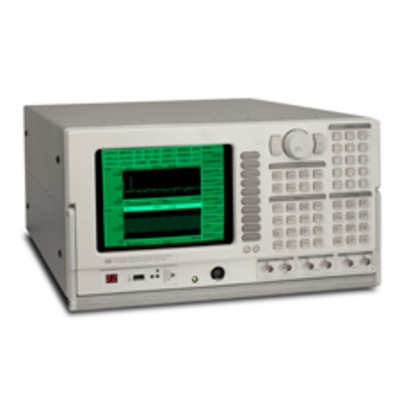
Dual Channel Dynamic Signal Analyzer
Sign Up/Login to get notified when someone has one for sale.
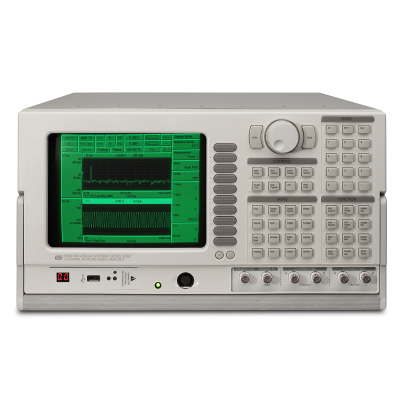
The SR780 Dynamic Signal Analyzer combines high performance and low cost in a full-featured package. It offers 102.4 kHz dual-channel FFTs with 90 dB dynamic range, swept-sine measurements, ANSI standard octave analysis, waterfall displays and transient capture for less than half the cost of other similarly equipped analyzers.
Spectrum Analysis
The SR780 delivers true two-channel, 102.4 kHz FFT performance. Its fast 32-bit floating-point DSP processor gives the SR780 a 102.4 kHz real-time rate with both channels selected. Two precision 16-bit ADCs provide a 90 dB dynamic range in FFT mode. Selectable 100 to 800 line analysis optimizes time and frequency resolution, and you can zoom in on any portion of the 102.4 kHz range with a frequency span down to 191 mHz.
Narrow Band FFT (top),
Wide Band FFT (bottom)
The SR780s unique architecture lets the two displays function independently. You can choose separate frequency spans, starting frequencies, number of FFT lines, or averaging modes for each display. So its easy look at a wideband display and zoom in on a specific feature simultaneously. The SR780 lets you select from two sampling rates: 256 kHz or 262 kHz, so frequency spans come out in either a binary (102.4 kHz, 51.2 kHz,…) or decimal (100 kHz, 50 kHz, 25 kHz,…) sequence depending on your requirements.
Flexible Averaging
Several averaging choices are provided. RMS averaging reduces signal fluctuations, while vector averaging minimizes noise from synchronous signals. You can choose linear averaging (stable averaging) for fixed signals, or exponential averaging to track drifting features. Because the SR780s 102.4 kHz real-time bandwidth lets it take data seamlessly, vector averaging can be selected for any signal thats repetitive within the time recordno trigger is necessary.
Transducer Units
Automatic unit conversion makes translating accelerometer data easy. You can enter accelerometer conversions directly in V/EU, EU/V or dB (1 V/EU). The SR780 will display results in units of meters, inches, mil, g, kg, lbs., N, dynes, pascals, bars, or dBSPL. Accelerometer data is automatically converted to velocity or displacement units. Built-in ICP power means you wont need an external power supply for your accelerometer.
Octave Analysis
Octave Analysis
Real-time octave analysis at frequencies up to 40 kHz (single channel) or 20 kHz (two-channel), is standard in the SR780. Octave analysis is fully compliant with ANSI and IEC standards. Full octave, 1/3 octave and 1/12 octave analysis are all available. Switchable analog A-weighting filters as well as built-in user math weighting functions (A,B and C) are included. Octave averaging choices include exponential time averaging, linear time averaging, peak hold, and equal confidence averaging. IEC compliant peak hold, impulse, fast and slow sound level measurements are all calculated.
Swept Sine Bode Plot
Swept-Sine Analysis
Swept-sine analysis is used for measurements involving high dynamic range or wide frequency intervals, and is also a standard feature of the SR780. Selectable auto-ranging optimizes the input range at each point in the measurement, providing up to 145 dB of dynamic range. Auto-ranging can be used with source auto-leveling to maintain a constant input or output level at the device under test. To ensure the fastest sweeps possible, auto-resolution can also be selected, providing a variable scan speed tailored precisely to the signal being measured.
User Math
User Math
User-defined math functions are available in all measurement groups. Equations are created from time or frequency data, stored files, constants, or a rich array of supplied operations including the arithmetic functions, FFT, inverse FFT, j, d/d, exp, ln x and many others. Unlike many analyzers, the SR780’s measurement rate isn’t reduced when user math is selected. For instance, the function exp(ln(conj(Average(FFT2/FFT1))) can be calculated with a 50 kHz real-time bandwidth.
Source
Six source types are available: low distortion (-80 dBc) single or two-tone sine waves, chirp, white noise, pink noise, and arbitrary waveforms. The chirp and noise sources can both be bursted to provide a source thats active only over a selected portion of the time record for FFT measurements, or to provide an impulsive noise source for acoustic measurements. The digitally synthesized source provides output levels from 0.1 mV to 5 V, and delivers up to 100 mA of current.
Arbitrary waveform capability is standard on the SR780. The arbitrary source can be used to playback a section of a captured waveform, play a selected FFT time record or upload a custom waveform.
Capture
The SR780 comes standard with 2 Msamples of standard capture memory. Waveforms can be captured at 262 kHz or any sub-multiple of 262 kHz, allowing you to select the sample rate and capture length thats right for your data. Once captured, any portion of the signal can be played back in FFT or Octave mode. The convenient AutoPan feature lets you display the measurement results synchronously with the corresponding portion of the capture buffer to easily identify important features. An optional memory expansion module lets you extend the SR780s capture depth to 8 Msamplesthats almost 30 seconds of capture at the maximum sampling rate.
Waterfall Plot
Waterfall
All Octave and FFT Measurements can be stored in the SR780s 2k-deep waterfall buffers. Waterfall storage is selectable as every nth time record for FFT measurements, or you can select a storage interval in seconds (down to 4 ms) for octave measurements. While displaying waterfalls, you can adjust the skew angle to reveal important features, or change the baseline threshold to eliminate low-level clutter. Any z-axis slice or x-axis record can be saved to disk or displayed separately for individual analysis.
Analysis
The SR780 includes a wide variety of built-in analysis features. Marker analysis lets you use the marker to easily measure the power contained in the harmonics, sidebands, or within a given band of frequencies. THD, THD+N, sideband power relative to carrier, and total integrated power are calculated in real time and displayed on the screen. Marker statistics quickly calculate the maximum, minimum, mean and standard deviation of data at any point in the display.
A data table feature lets you display up to 100 selected data points in tabular format. Limit tables allow you to define up to 100 upper and lower limit segments in each display for GO/NO-GO testing.
Output
The SR780’s built-in USB drive, computer interfaces (GPIB and RS-232) and printer port provide flexibility when saving, printing and exporting data. Data can be saved in binary or ASCII formats and displays can be printed/plotted to any of the ports or the disk drive. Supported formats include PCL, GIF, PCL (LaserJet/ DeskJet), dot-matrix, postscript and HP-GL, PCX or GIF. Utilities are included to translate your HP SDF files into SR780 format.
DC to 102.4 kHz bandwidth
90 dB dynamic range
Low-distortion synthesized source
145 dB dynamic range (swept-sine)
Real-time octave analysis
Up to 32 Mbyte memory
GPIB and RS-232 interfaces
There are no reviews for this product at the moment